Browse additional economic indicators and data sets, selected by Global Finance editors, to learn more about Burundi economic outlook, debt to GDP ratio, international trade performance and population trends. Rankings of Burundi best banks and safest banks are also available.
Basic Information
Government Type: Presidential republic
Capital City: Gitega (political capital), Bujumbura (commercial capital); note – in January 2019, the Burundian parliament voted to make Gitega the political capital of the country while Bujumbura would remain its economic capital; all branches of the government are ex
GDP & Economic Information
Macroeconomy & Sovereign Data
| Central Bank | Bank of the Republic of Burundi |
|---|---|
| Currency | Burundi francs (BIF) |
| International Reserves |
USD 0.07 billion (2018) International Monetary Fund (IMF), data retrieved October 2019 |
| Gross Domestic Product – GDP | USD 3.4 billion (2018, estimate) |
| GDP (Purchasing Power Parity) | Intl$ 8.2 billion (2018, estimate) |
GDP Data
| Real GDP growth |
2007: 3.5% 2008: 4.9% 2009: 3.8% 2010: 5.1% 2011: 4% 2012: 4.4% 2013: 5.9% 2014: 4.5% 2015*: -4% 2016*: -1% 2017*: 0% 2018*: 0.1% *Estimate |
|---|---|
| GDP per capita – current prices | USD 307.0 (2018, estimate) |
| GDP per capita – PPP | Intl$ 732.5 (2018, estimate) |
| GDP (PPP) – share of world total | 0.006% (2019, estimate) |
| GDP – composition by sector |
agriculture: 39.5% industry: 16.4% services: 44.2% (2017 estimate) |
| Gross domestic expenditure on R&D; (% of GDP) | N/A |
| Inflation |
2015: 5.6% 2016: 5.5% 2017: 16.6% 2018*: 1.2% 2019*: 7.3% *Estimate |
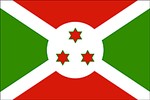
Burundi
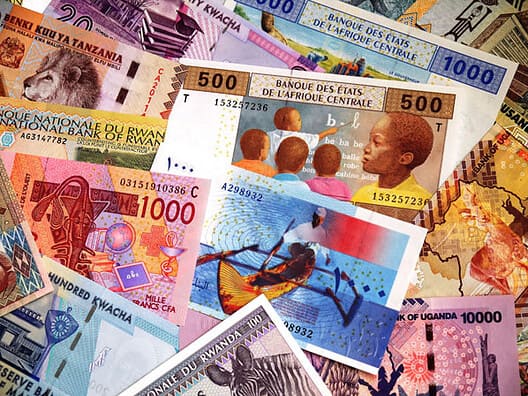
Emerging & Frontier Markets
An EU In Africa?
Award Winners
Best Trade Finance Banks 2011

Emerging & Frontier Markets
Africa’s Lion Awakens
Inflation & Debt
| Inflation |
2015: 5.6% 2016: 5.5% 2017: 16.6% 2018*: 1.2% 2019*: 7.3% *Estimate |
|---|---|
| Government Bond Ratings |
Standard & Poor’s: N/A Moody’s: N/A Standard & Poor’s / Moody’s |
| Unemployment rate | N/A |
| Household saving rates | N/A |
| Public debt (General government gross debt as a % of GDP) |
2015*: 45.3% 2016*: 48.4% 2017*: 51.7% 2018*: 58.4% 2019*: 63.5% *Estimate |
| Public deficit (General government net lending/borrowing as a % of GDP) |
2015*: -5.3% 2016*: -6.2% 2017*: -7.8% 2018*: -8.6% 2019*: -9.1% *Estimate |
| Market value of publicly traded shares | N/A |
| Largest Companies | N/A |
Import/Export
| Exports as percent of GDP (Exports of goods and services) | 6.4% (2016) |
|---|---|
| Shares in world total merchandising export |
0.001% (2018) |
| Shares in world total commercial services export | 0.0003% (2017) |
| Total exports | USD 236.5 million (2017) |
| Export commodities | Coffee, tea, sugar, cotton, hides |
| Total imports | USD 855.0 million (2017 estimate) |
| Import commodities | Capital goods, petroleum products, foodstuffs |
| Exports – major partners |
Democratic Republic of the Congo 25.5%, Switzerland 18.4%, UAE 14.9%, Belgium 6% (2017) |
| Imports – major partners |
India 18.5%, China 13%, Kenya 7.9%, UAE 6.8%, Saudi Arabia 6.8%, Uganda 6%, Tanzania 5.4%, Zambia 4.6% (2017) |
Competitiveness & Trade
| Current account balance | USD -0.5 billion (2018 estimate) |
|---|---|
| Current account balance by percentage of GDP |
-13.4 % (2018 estimate) |
| FDI inflows |
2016: USD 0.1 million 2017: USD 0.3 million 2018: USD 1.0 million |
| FDI Outflows |
2016: USD 0.1 million 2017: USD 0.3 million 2018: USD 1.0 million |
| Value of cross-border M&A, by country of purchaser |
N/A United Nations Conference on Trade and Development (UNCTAD) – World Investment Report |
| Cross-border M&A deals worth over $3 billion completed in 2014 | N/A |
| Cross-border M&A deals worth over $3 billion completed in 2015 | N/A |
| Best countries for doing business |
Economies are ranked on their ease of doing business. A high ease of doing business ranking means the regulatory environment is more conducive to the starting and operation of a local firm. Overall ranking: 166 out of 190 countries Subcategories: Starting a Business: 44 out of 190 countries Dealing with Construction Permits: 161 out of 190 countries Getting Electricity: 184 out of 190 countries Registering Property: 100 out of 190 countries Getting Credit: 176 out of 190 countries Protecting Minority Investors: 143 out of 190 countries Paying Taxes: 140 out of 190 countries Trading across Borders: 169 out of 190 countries Enforcing Contracts: 158 out of 190 countries Resolving Insolvency: 147 out of 190 countries World Bank – Doing Business 2019 |
| Global competitiveness ranking |
135 out of 141 countries (2019) |
| Index of Economic Freedom |
Ranking: 162 / Score: 48.9 (Repressed) (100=totally free 0=totally repressed) |
Population & Geographic Data
| Time Zone |
UTC+2 |
|---|---|
| Total Area | 27,830 sq km |
| Total Population |
1990*: 5.46 million 2000*: 6.68 million 2010*: 8.78 million 2015*: 10.2 million 2020*: 11.88 million *Estimate |
| Urban population as % of total population |
1960: 2.1% 1980: 4.3% 2000: 8.2% 2018: 13% |
| Population median age | 17.1 years |
| Population growth rate | 3.23% (2018 estimate) |
| Life expectancy | 61.4 years (2018 estimate) |
| % of population living on less than $3.10 a day | 89.3% (last available estimate, 2013) |
| Inequality of wealth distribution (Gini index) |
38.6 (last available estimate, 2013) |
| Freedom House rating |
Not Free Political Rights: 7 Civil Liberties: 6 (2019) (1 represents the most free, 7 the least free rating) |
| Total telephone subscribers as % of population |
Fixed: 0.2% Mobile: 56.5% (2018) (fixed-telephone subscribers and mobile-cellular subscribers) |
| Internet users as % of total population | 2.66 % (2017) |
Language & Religon
| Languages |
Kirundi 29.7% (official), Kirundi and other language 9.1%, French (official); French and other language 0.3%, Swahili; Swahili and other language 0.2% (along Lake Tanganyika and in the Bujumbura area), English (official); English and other language 0.06%, |
|---|---|
| Literacy |
Total population: 85.6% Male: 88.2% Female: 83.1% Definition: age 15 and over can read and write (2015 est.) (age 15 and over can read and write) |
| Religions |
Roman Catholic 62.1%, Protestant 23.9% (includes Adventist 2.3% and other Protestant 21.6%), Muslim 2.5%, other 3.6%, unspecified 7.9% (2008 est.) |
World Rankings
| Population | 11.88 M |
|---|---|
| Mercer Cost of living index | N/A |
| C02 Emissions per capita |
0.04 metric tons per capita (2014) |
Global Finance Rankings & Awards: Burundi
Global Finance Magazine holds several conferences and awards ceremonies throughout the year to recognize the winning financial institutions and companies in a host of categories including World’s Best Trade Finance Banks, World's Biggest Banks, World's Safest Banks, World's Best Developed & Emerging Markets Banks, World's Best Internet Banks, and World’s Best Investment Banks.Data Sources:
IMF World Economic Outlook
UN World Population Prospects
World Inequality Report
S&P Global Ratings
Moody’s
Fitch Ratings
IMF Direction of Trade Statistics (DOTS)
UN Conference on Trade and Development (UNCTAD)
CIA The World Factbook
World Bank’s World Integrated Trade Solution
Forbes Global 2000